December 2023 Orange County Market Update
December saw a continuation of the slowdown in the Orange County real estate market, with lower sales volume across all property types. However, median sales prices remained relatively stable, indicating a resilient market despite weaker sales activity. The increase in inventory suggests a gradual shift towards a more balanced market, offering more options for buyers in the coming months. Buyer behavior is changing, with more homes selling below asking price, demonstrating their growing influence in the current market conditions. As we move into the new year, cautious optimism prevails, with the potential for renewed buyer activity as the weather warms and market dynamics adjust to evolving interest rates and economic conditions. Key takeaways: Market slowdown continues: Sales volume dipped across all property types compared to November. Price stability amid slower activity: Median sales prices remained relatively steady for single-family homes and condos, indicating continued resilience. Shifting buyer behavior: More homes selling below asking price, suggesting buyers gaining leverage as market cools. Inventory on the rise: Listings increased for all property types, potentially offering more options for buyers in the coming months. Sales Volume: Single-family homes: Down 8.6% compared to November, with 1,248 homes sold. Condos: Down 9.1% compared to November, with 821 condos sold. Townhouses: Down 5.4% compared to November, with 237 townhouses sold. Price Trends: Single-family homes: Median sales price of $1.1 million, up 0.2% from November and 17.3% year-over-year. Condos: Median sales price of $748,000, up 0.6% from November and 12.4% year-over-year. Townhouses: Median sales price of $815,000, down 0.5% from November and 10.8% year-over-year. Inventory Levels: Single-family homes: Increased by 2.2% compared to November, with 6,021 listings available. Condos: Increased by 3.9% compared to November, with 3,804 listings available. Townhouses: Increased by 5.4% compared to November, with 1,287 listings available. Buyer/Seller Behavior: Increased competition among sellers: 46% of single-family homes and 48% of condos sold below asking price, while townhouses remained closer to asking (42% below, 34% at asking, 24% above). Buyers gaining leverage: Rising inventory and slower sales pace providing more negotiating power for buyers. Cautious optimism: While market activity softened, overall sentiment remains positive with continued price stability and potential for renewed buyer interest in the spring.

Housing marketing conditions in Orange County
As of October 2023, the Orange County housing market has experienced significant changes compared to the previous year: Home prices have increased by 12.4%, with the median price reaching $1.1 million. The average time homes stay on the market has reduced to 35 days, down from 48 days last year. The number of homes sold in October was 1,666, a decrease from the 1,764 homes sold in the same month last year. The sale-to-list price ratio was 100%, indicating that homes, on average, sold for their asking price. This is a 1.4 percentage point increase from the previous year. 44.1% of homes sold above their list price, a significant increase of 14.2 percentage points compared to last year. The percentage of homes with price drops was 24.4%, showing a decrease of 7.7 percentage points from the previous year

Real Estate Market Report - Laguna Beach, CA (Nov, 2023)
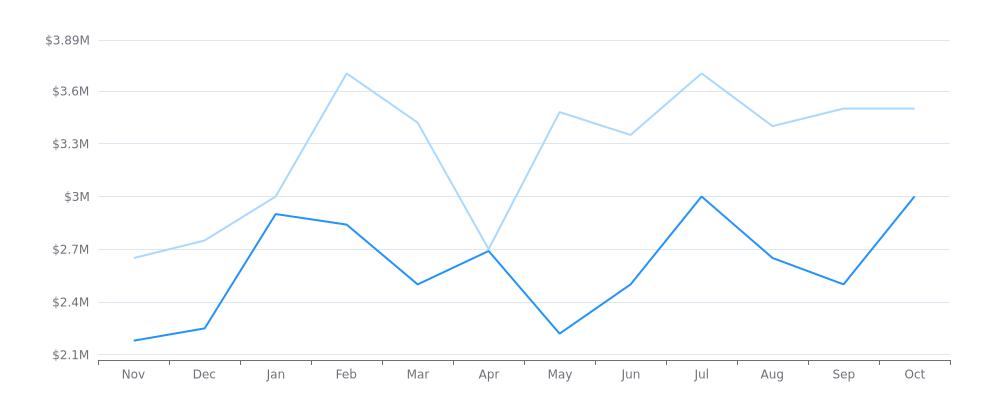
Current Market Condition 328 Active Listings 51 Pending Listings $3,795,000 Median List Price View Properties for Sale Find Out Your Home Value The median sale/list price for the first set of data starts at $2,650,000 in November 2022 and steadily increases to $3,699,800 in July 2023 before dropping slightly to $3,499,999 in October 2023. The median sale/list price for the second set of data starts at $2,178,000 in November 2022 and increases to $3,002,500 in January 2023 before fluctuating between $2,215,000 and $3,002,500 for the rest of the year. Median Sale/List Price List Price Sale Price The median sale price per square foot has increased steadily from November 2022 to March 2023, with a peak of $1536.378 in March. However, the price then shows a slight decline in the following months, with a low of $1214.459 in June. It picks up again in July and August, reaching a new high of $1693.767 in August, before decreasing slightly again in September and October. Median Sale Price per Square Foot The median sale price to list price ratio for the housing market is showing some fluctuations in the coming months, with a high of 0.988 in June 2023 and a low of 0.934 in January 2023. Overall, the ratio seems to be hovering around the mid-0.96 range for the most part, with a slight dip in August 2023. Median Sale Price to List Price Ratio The data shows the number of properties sold/listed per month over a 12-month period. The highest number of properties sold/listed was in May with 60, while the lowest was in February with 14. The trend seems to be increasing from November to May, and then decreasing from June to October. Properties Sold/Listed Properties Listed Properties Sold The median days on market for homes in the given data range varies from 53.0 to 121.0 days, with the shortest median days occurring in May and June of 2023, and the longest in January. The median days on market tend to fluctuate, with some months being consistently lower or higher than others. Median Days on Market
Categories
Recent Posts


